Creating a call graph visualizer
I wanted to get back into one of my projects, but 6 months had gone by since the last time I touched this codebase. I could remember the general idea, but I had forgotten a lot of the structure, making navigating a pain. This is where I thought a simple call graph visual, outlining the project’s main functions and where they’re called, would help with navigating the project.
I found go-callgraph, excellent work from BaseMax. But I had to take the output and run it into Graphviz, and the online Graphviz crashed because the graph was too big. So I thought there’s definitely an easier way to get to what I want.
So I started katastrōnō-ing a plan (Greek for “putting together”). I had a solid starting point. I decided to use only Rapid Type Analysis (RTA) to cut out a lot of the noise. Then I filtered out any functions that weren’t from the project being analyzed (stdlib, etc.). Finally, I kept the same JSON export but deleted anything related to DOT export, since I wouldn’t use it at all.
For the visualization part, I was contemplating making some sort of frontend using Svelte. But I really wanted to keep the tool as a CLI, and creating a separate frontend that needed building, plus adding a RESTful endpoint to serve the data, seemed like overkill for this simple task.
I ended up creating a simple HTML file. I used Cytoscape and Dagre, then asked AI to cook up some nice CSS. Lastly, I fed it the JSON data, and voilà, graph ready.
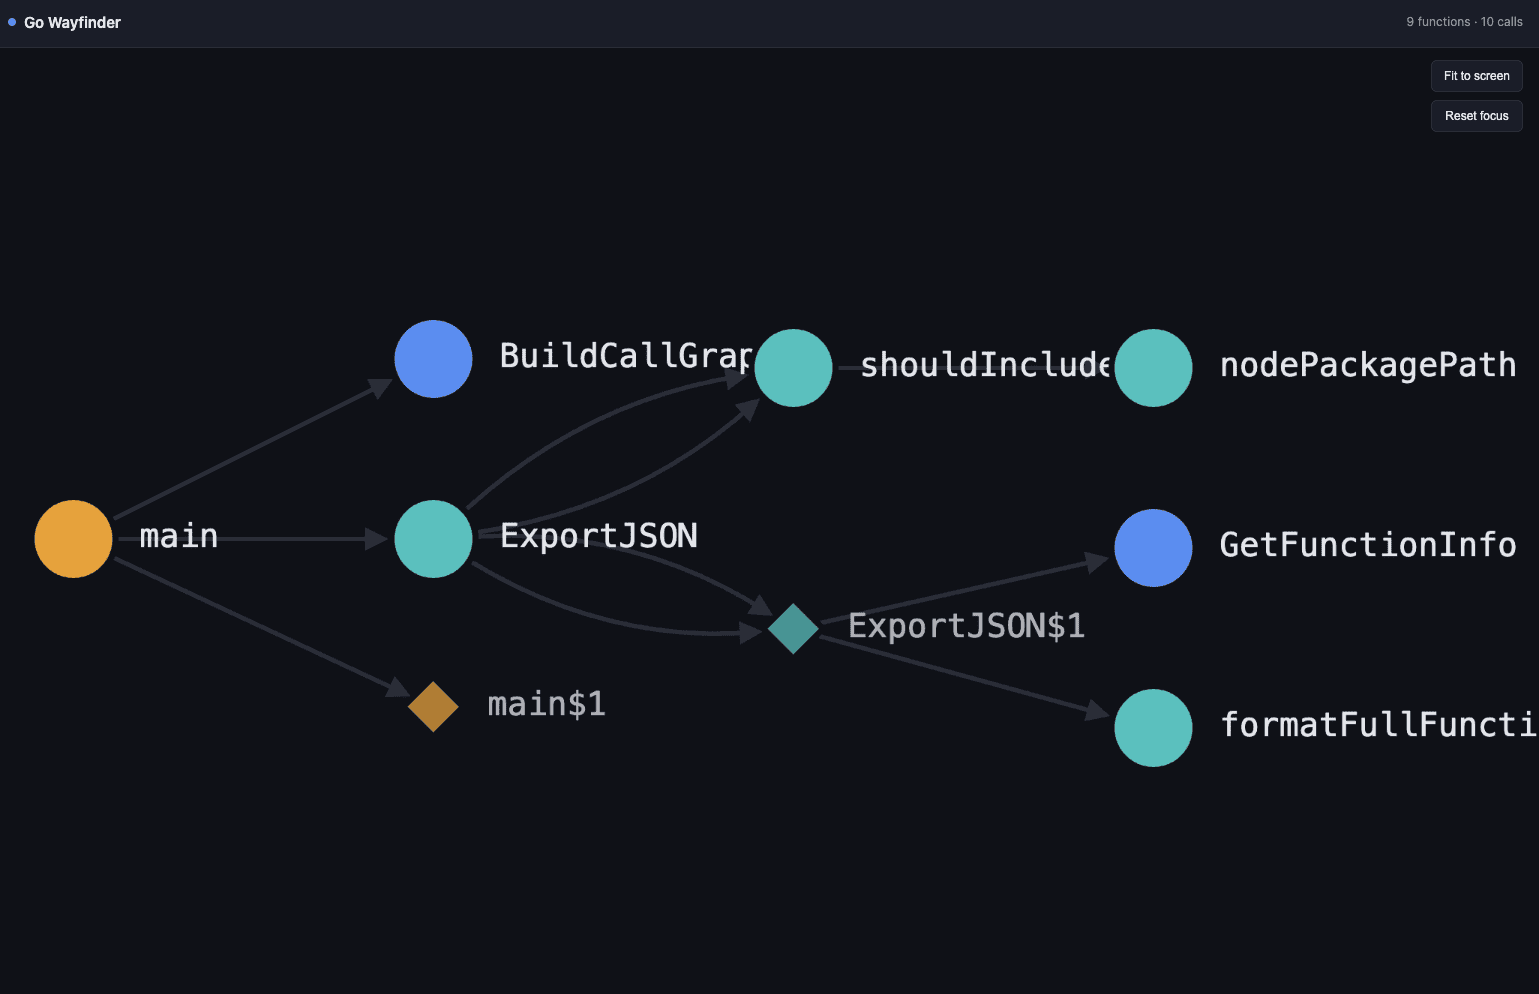
Nice and easy one-day build, and now I can finally get back into the original codebase.
I’m planning to extend it with extra features: graph filtering and querying, and making sure performance holds up for bigger codebases.